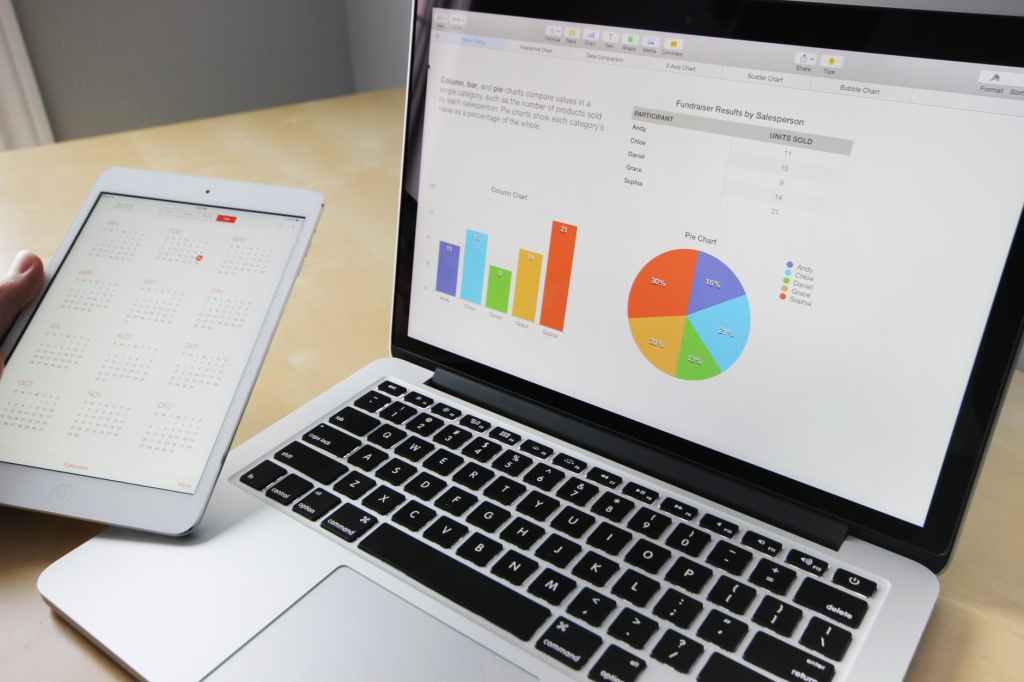
Student Project Presentation. Representing Data.

Today’s project is to create a short presentation showing some data. Use presentation software to illustrate data and describe what it represents to your classmates.
The subject matter doesn’t need to be complicated, it can be something very mundane or obvious. The important thing is that you have some visual data to describe.
Your presentation should be at least 3 minutes long but ideally not more than 7 minutes.
Obviously there are a lot of possibilities and you can choose whatever you want but you may want to consider the following suggestions:
A timeline to show a chain of events.
A pie chart to show what proportions of something variables share.
A line graph to show the value of a variable over time.
A histogram to show the distribution of something over different ranges.
